The goal of this project was to create any game using something from every unit we learned in our Computer Science 20 course.
Traffic Jam Game (HTML/CSS/Javascript)
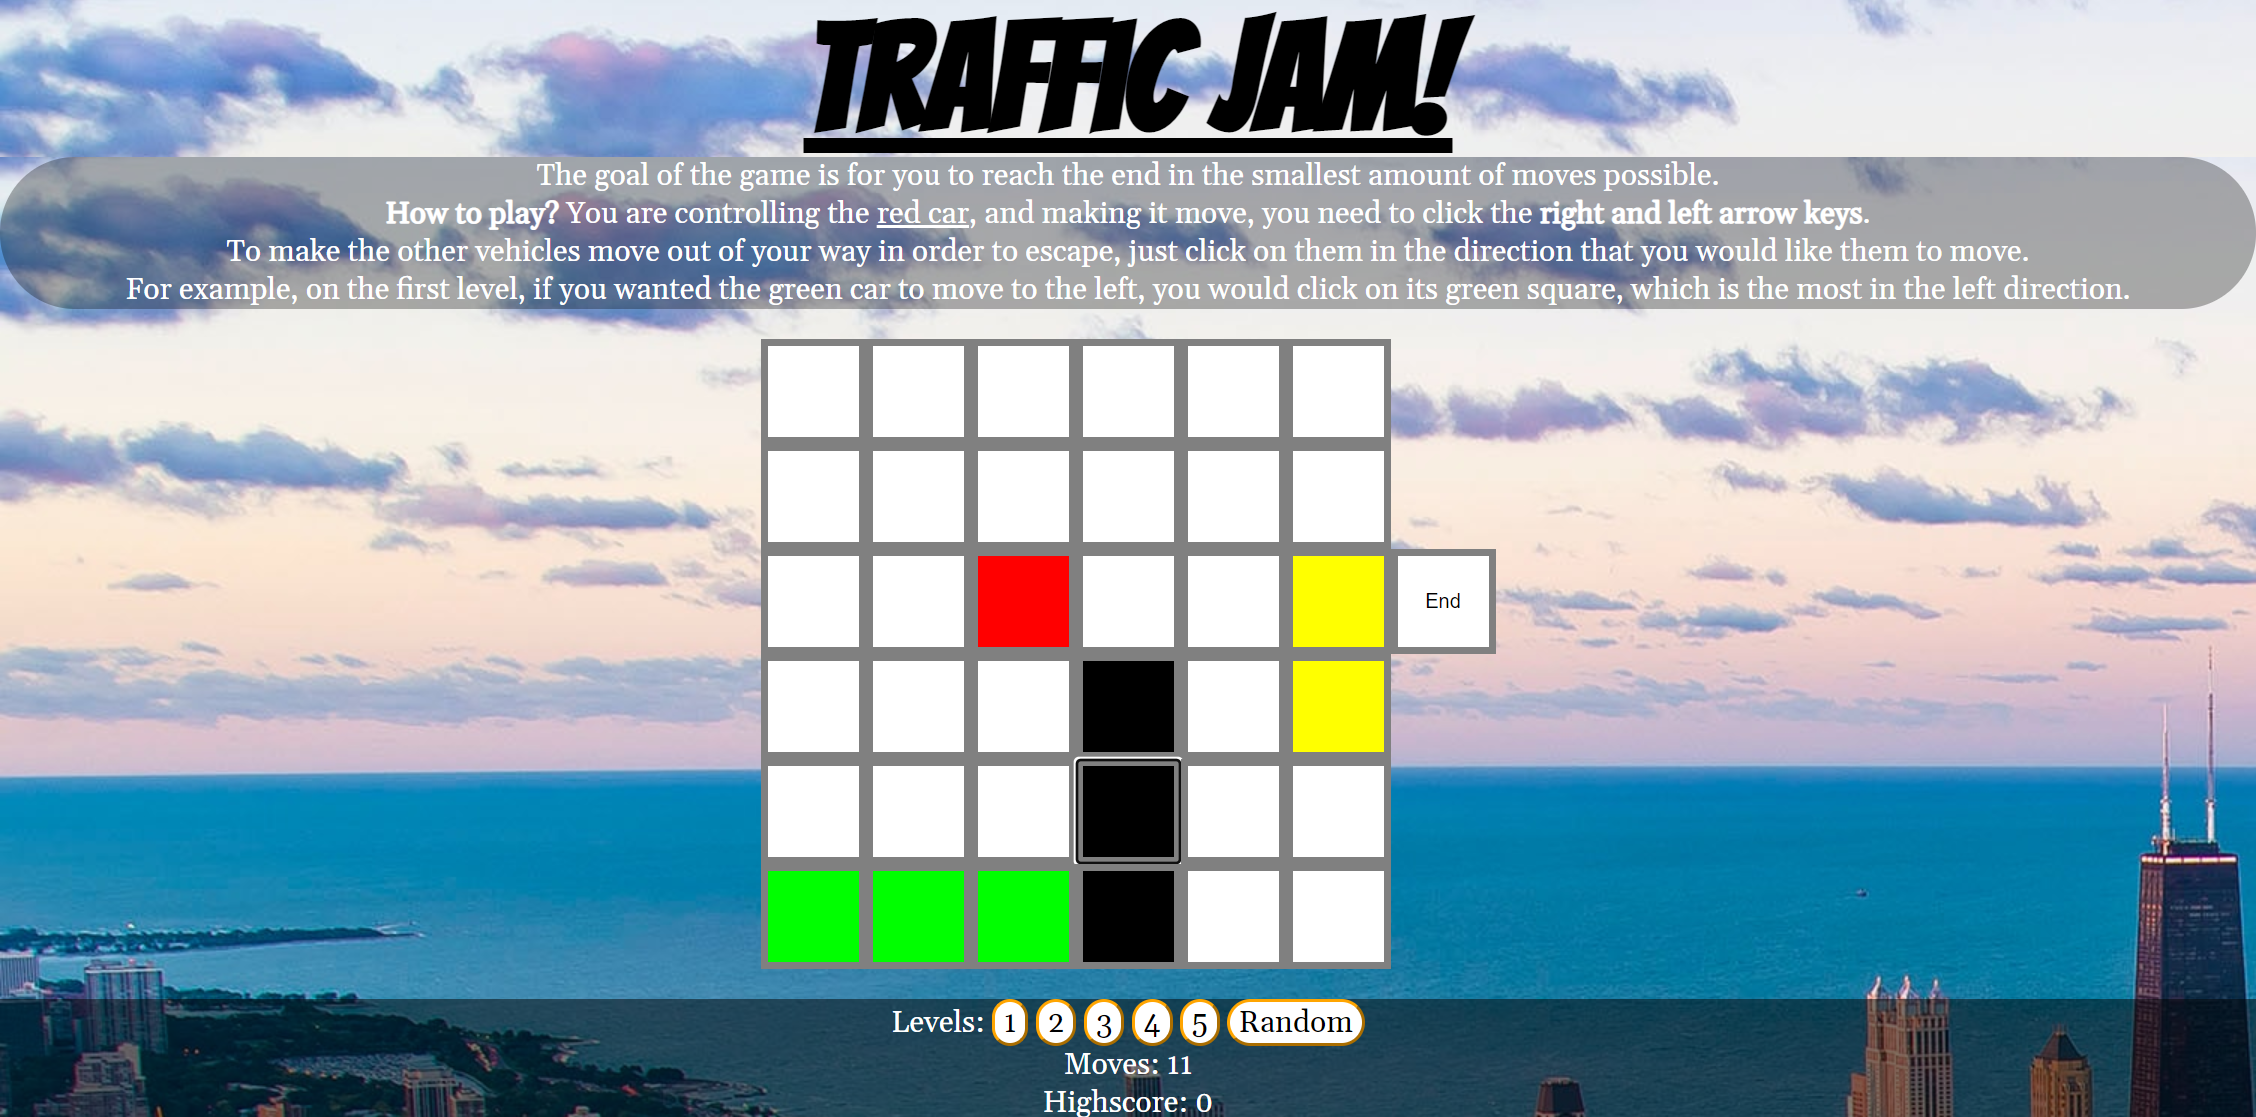
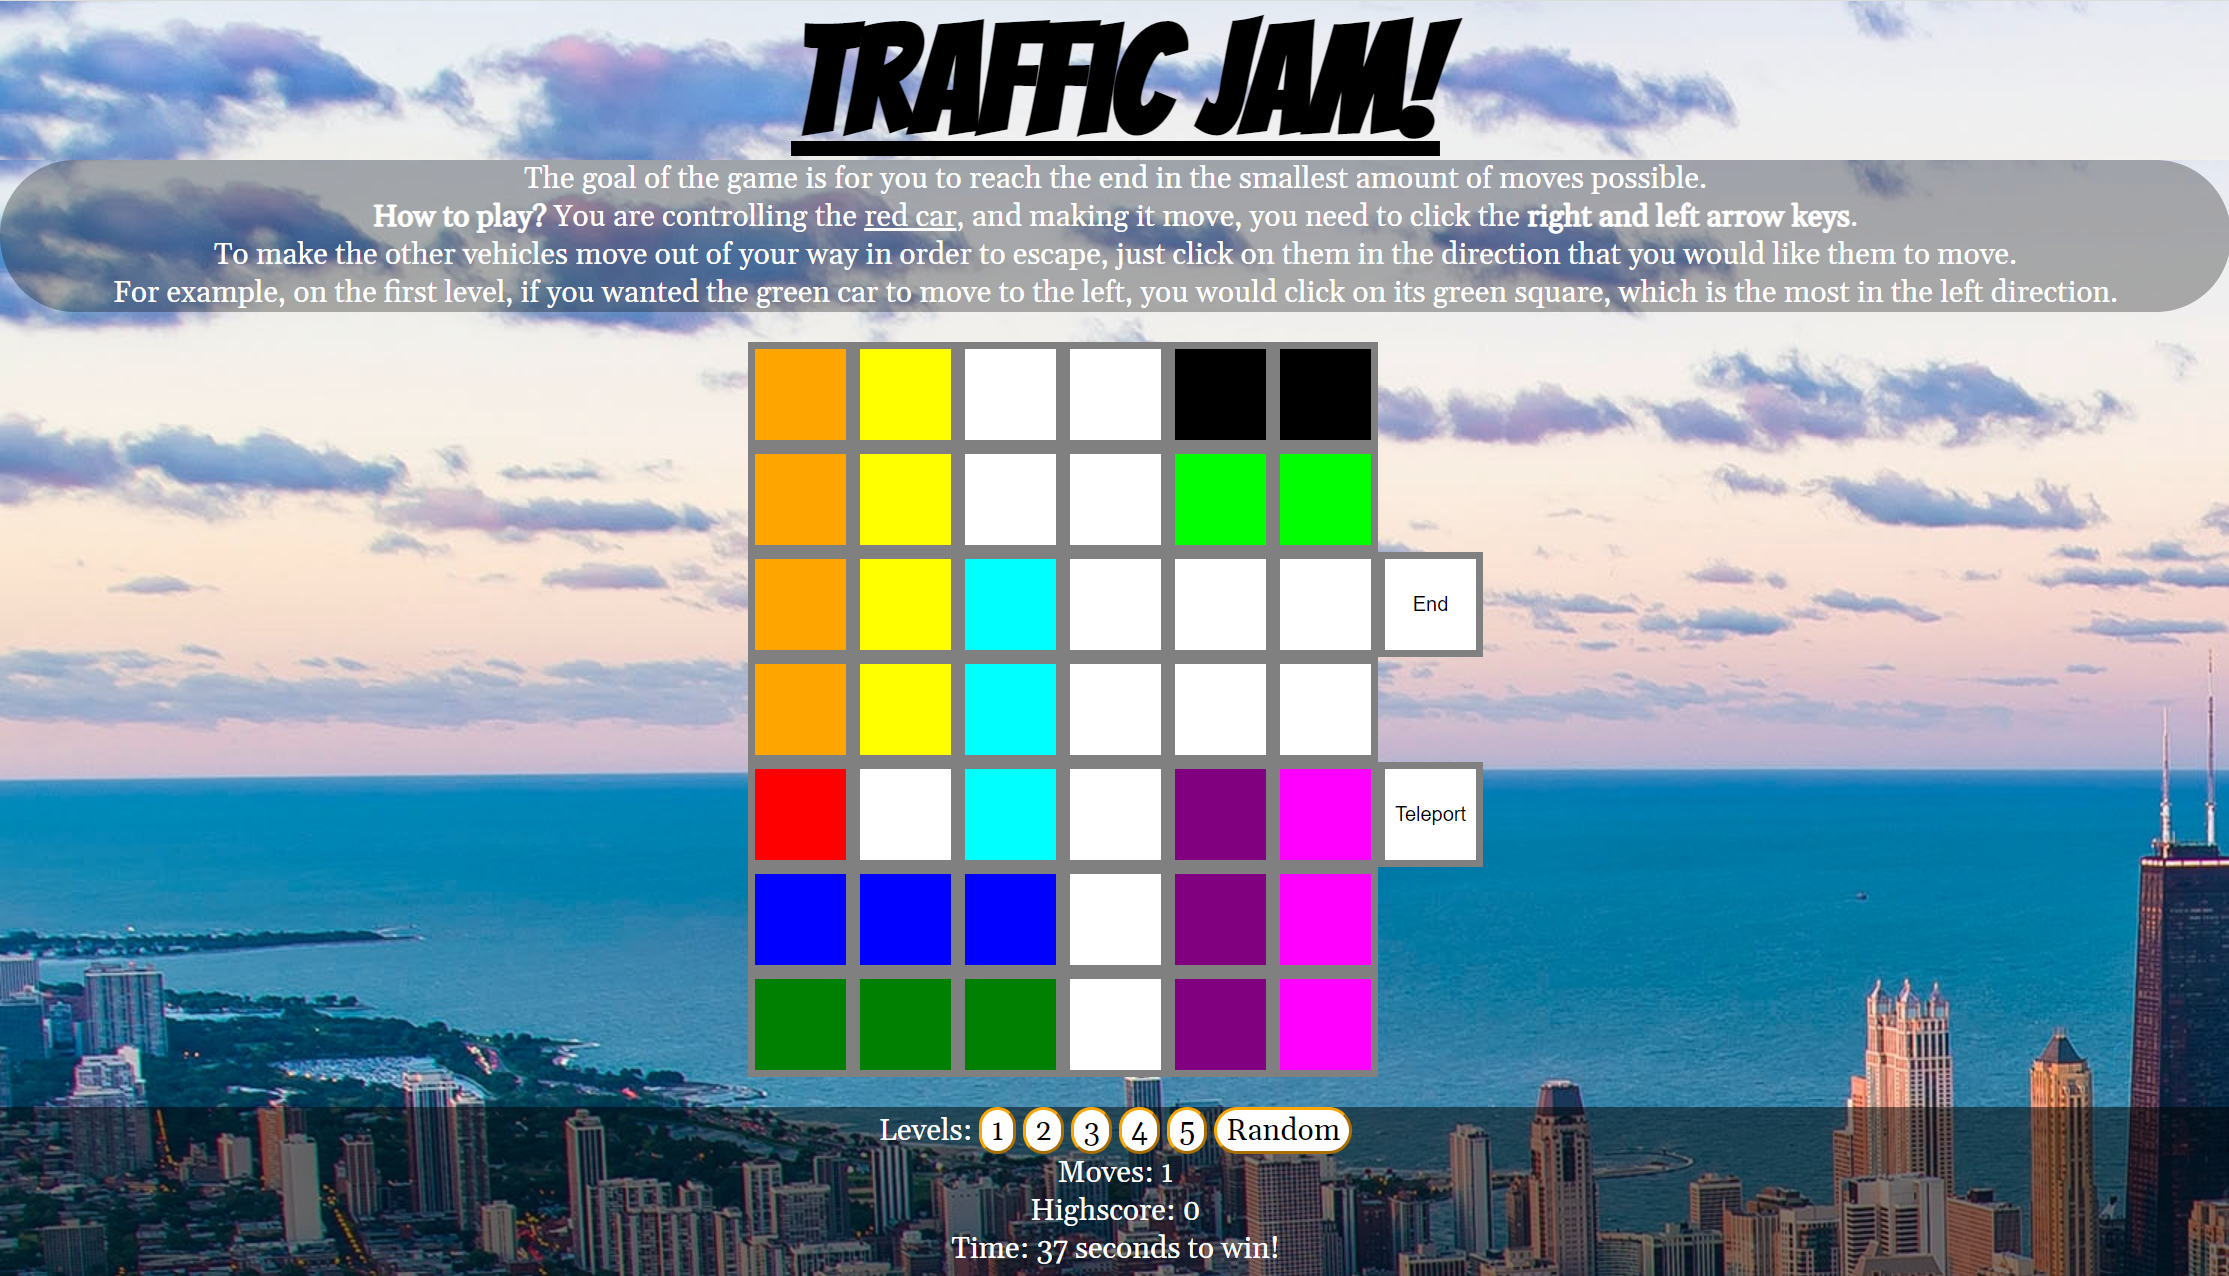
As a part of my grade 11 computer science class I decided to recreate a game (Traffic Jam) using the lanaguages I had learnt in that class HTML/CSS and Javascript. The project consists of over 1000 lines of code. To try out the game just click on the "Traffic Jam" Heading!
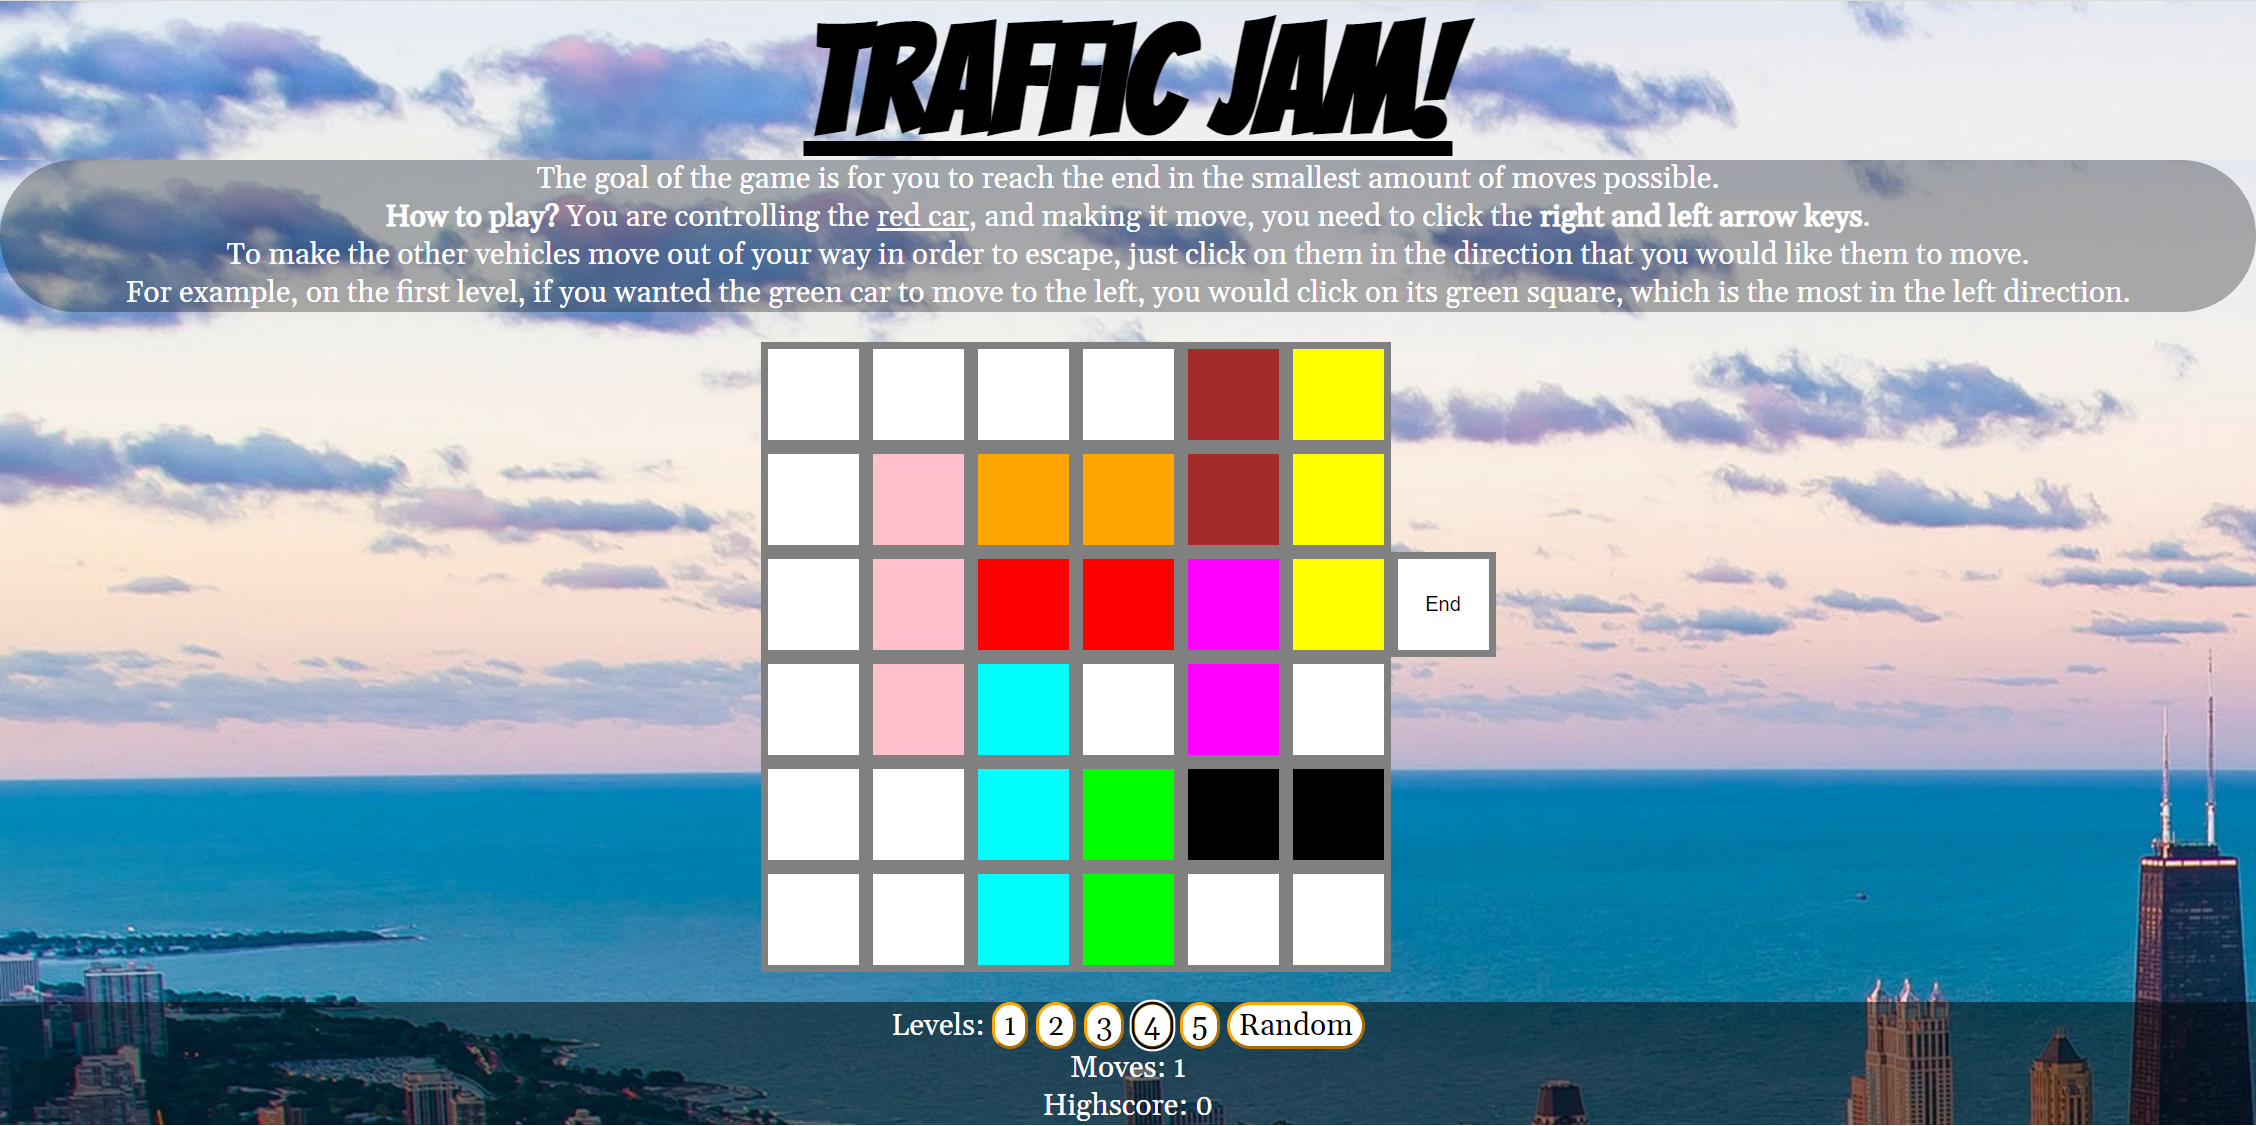
In the end the game I created had 5 levels, with levels 3-5 each having a unique trait to that specific level, which was a challenge at the time with minimal coding experience.
Website (HTML/CSS/Javascript)
My main contribution to the 1st place BC HACKS project was building an entire website for Zero Carbon Ecosystem. More info on this and the rest of the project can be found at the Devpost link here.
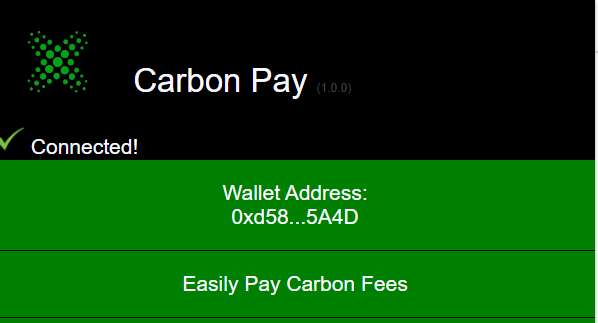
Chrome Extension (JSON/Javascript/HTML/CSS)
As a part of Zero Carbon Ecosystem we created a chrome extension crypto wallet to demonstrate the usability of our product.
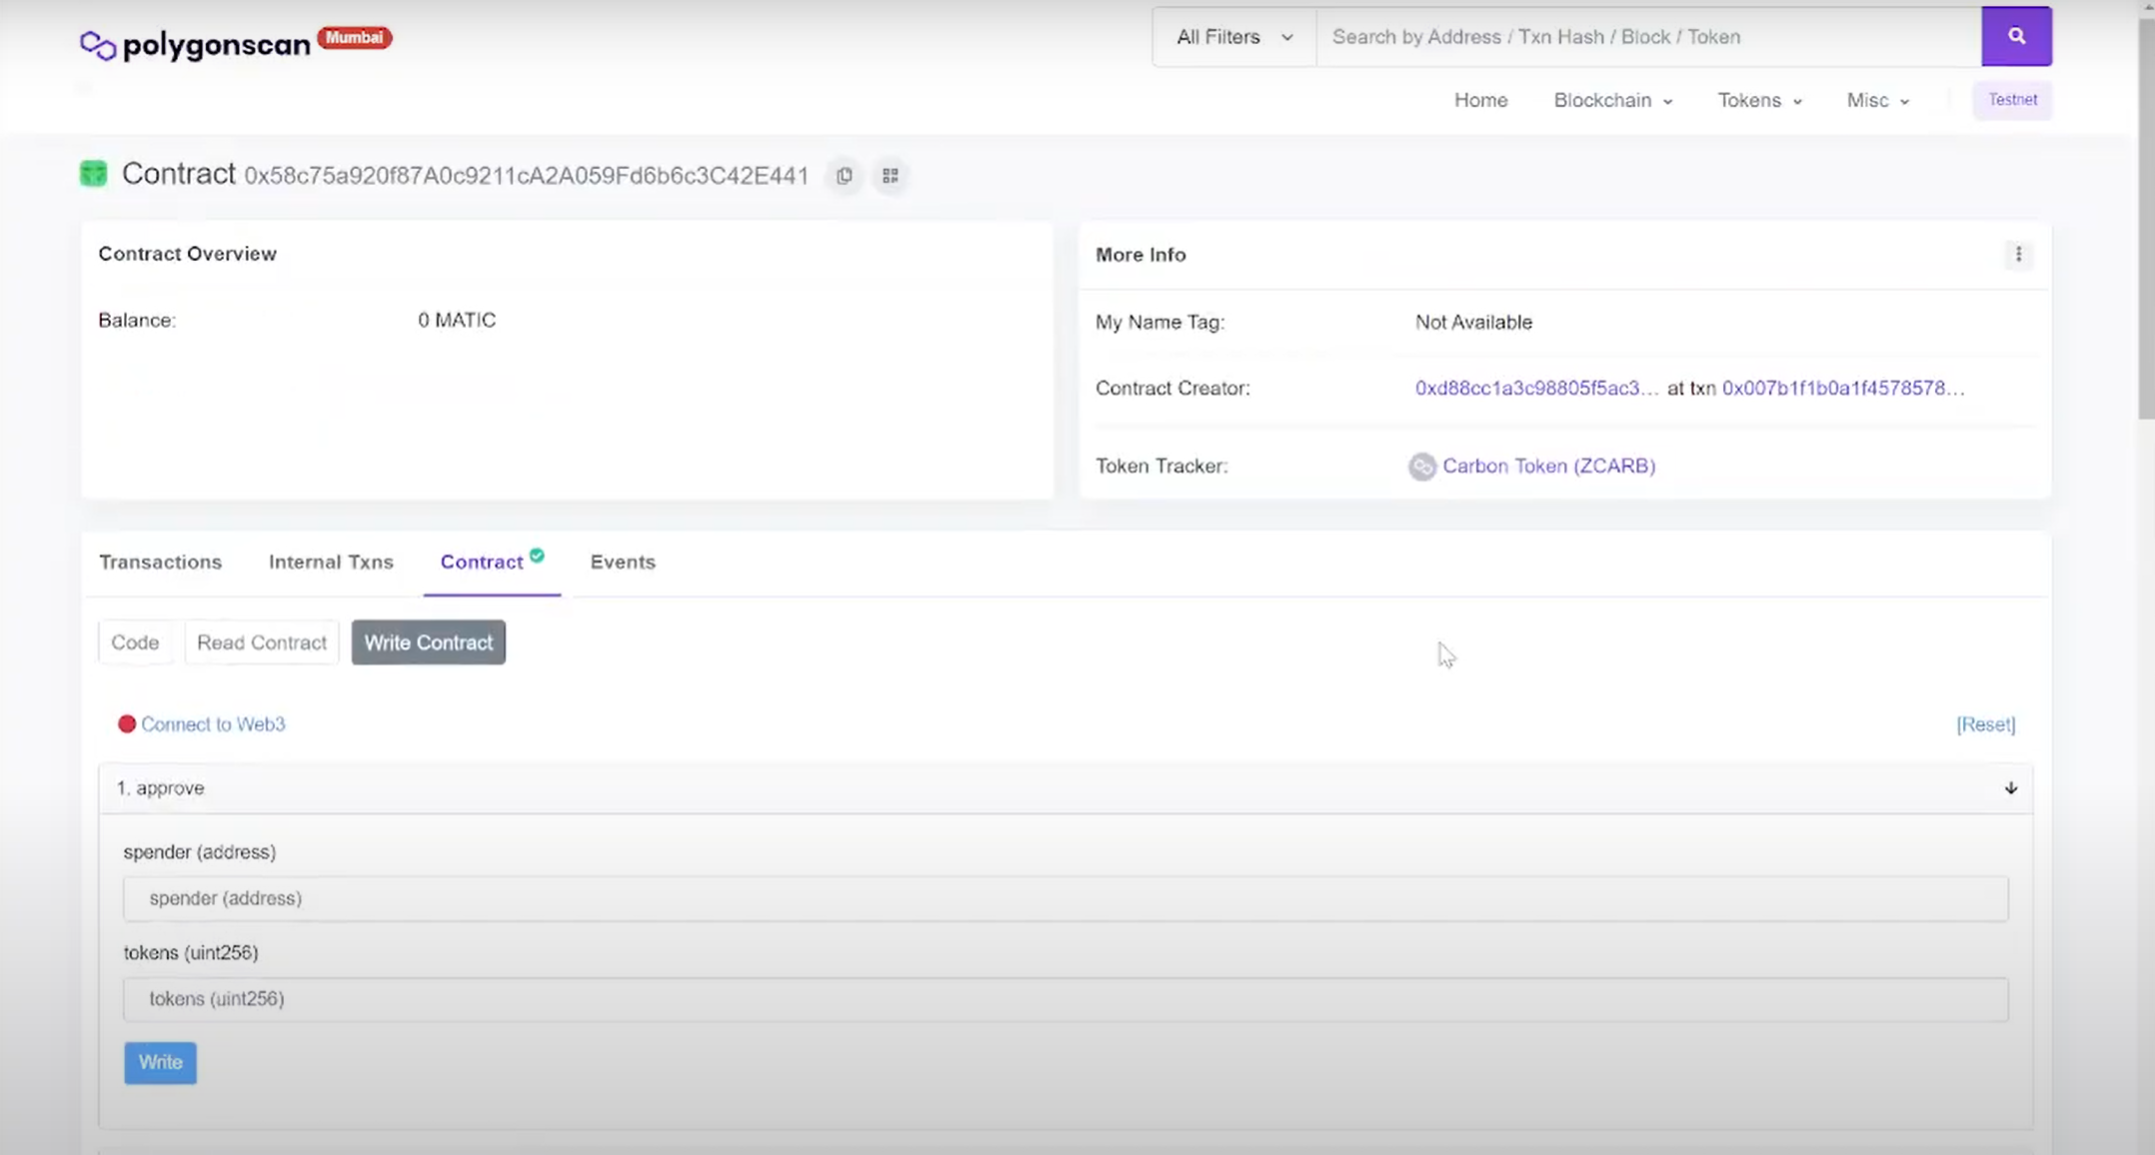
The Crypto $ZCARB (Solidity)
What really brought home the win for my team was how we were able to demonstrate a working crypto currency after only 24 hours. Using polygon we made this a reality.
Website (Angular / Bootstrap)
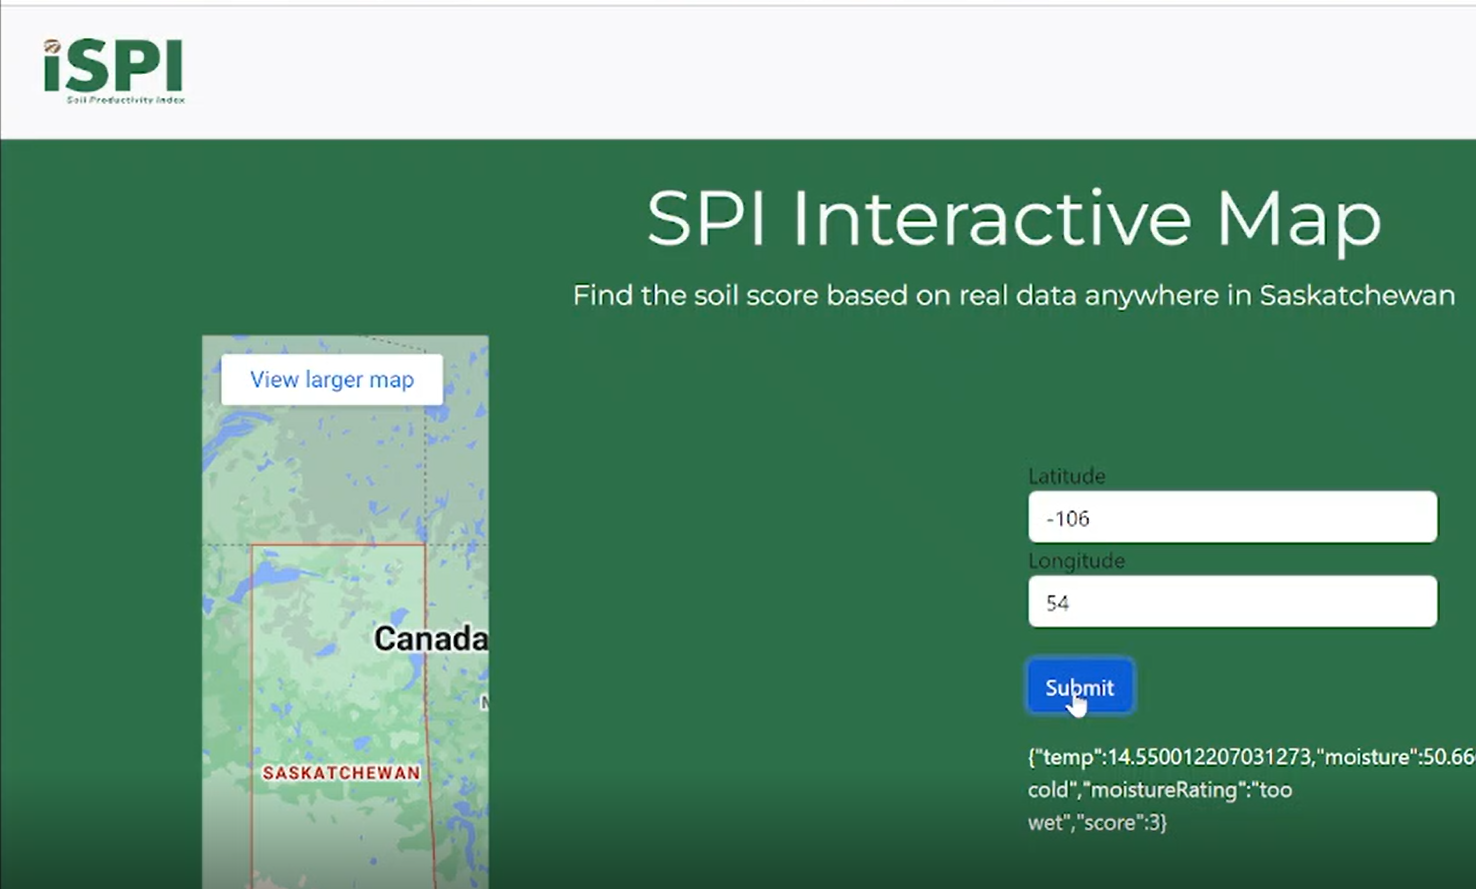
My main contribution was the webapp development for iSPI, which really brought the technology together. Using google maps API and tying it in with the backend this Angular Bootstrap website allowed users to generate a soil score based on map coordinates. Click on the iSPI heading for a demo.
The Business Presentation
Since iSPI was a part of the 24 hour startup competition at Canada's Farm Show in Regina, the project was also evaluated based on a business presentation. The judges included developers, entrepreneurs, business executives and a Dragon - Vikram Vij from Dragon's Den. The business presentation combined with the technology earned my team 2nd place in the competition.
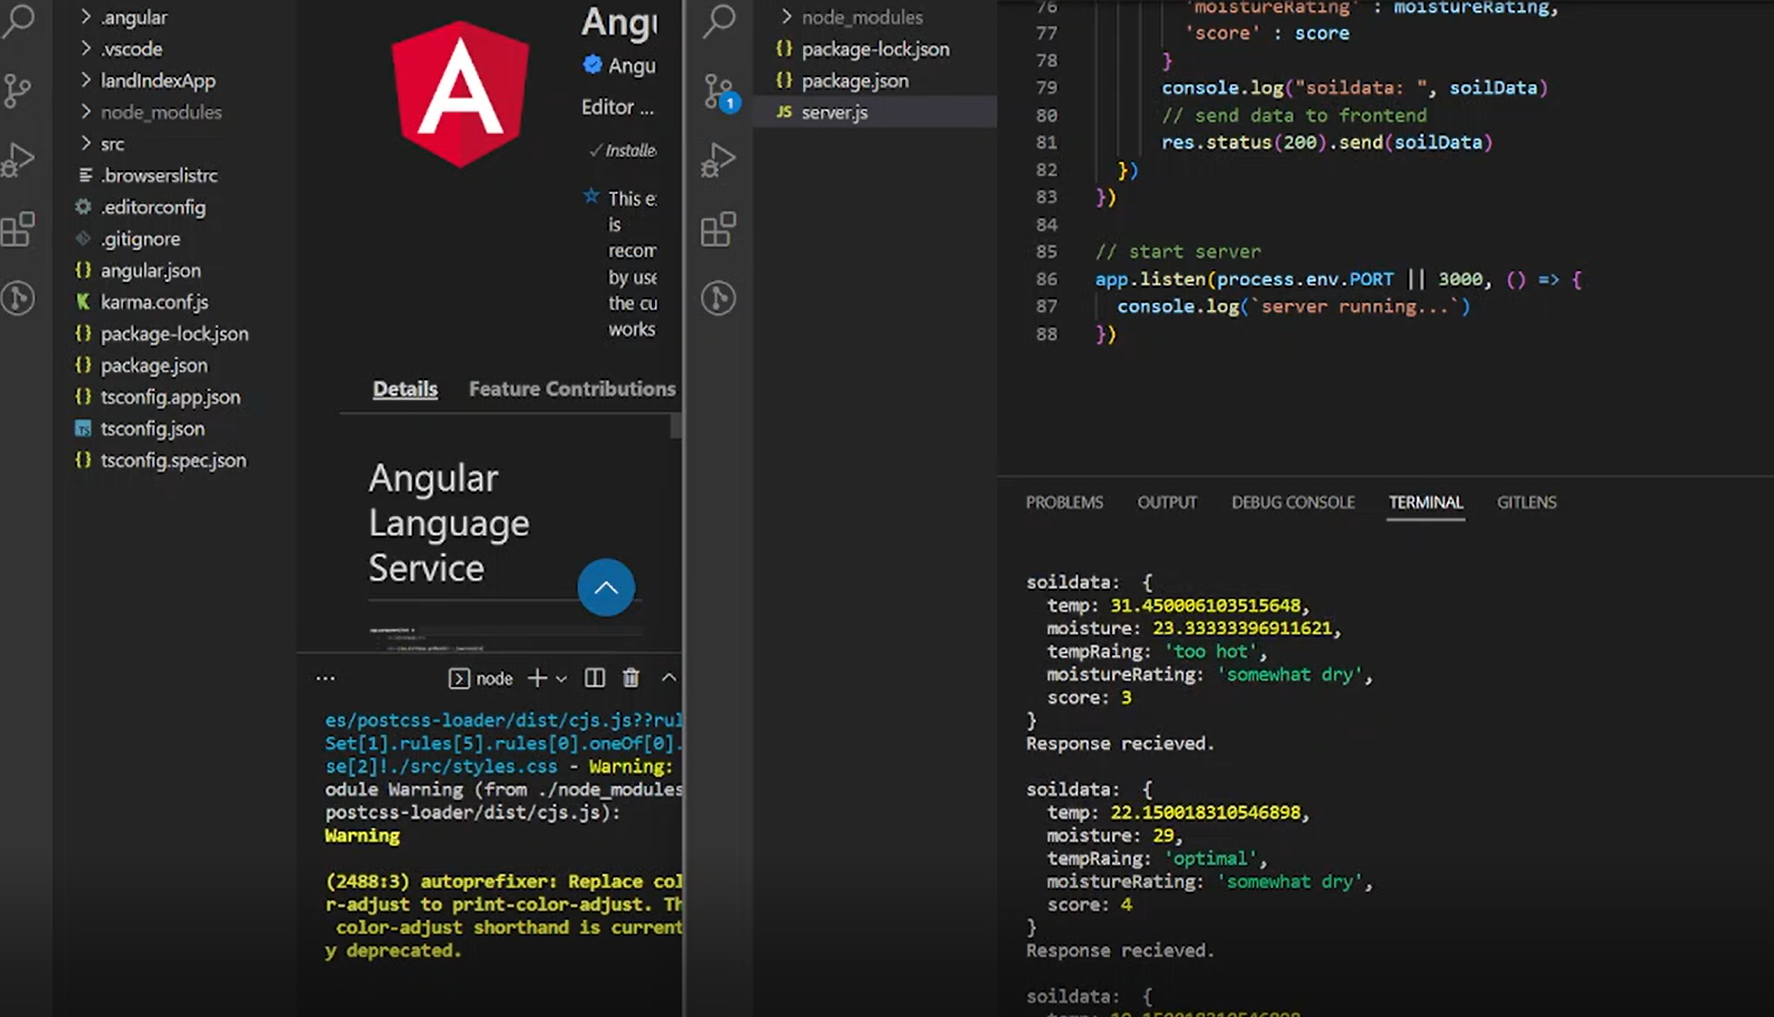
The Backend (Node.js / JSON)
The backend of the application ran using Node.js and JSON. By implementing the Ambee API, which contains soil data from across the world we built an algorithm that rated soil quality based on various factors such as moisture, temperature and climate.
My Portfolio Website
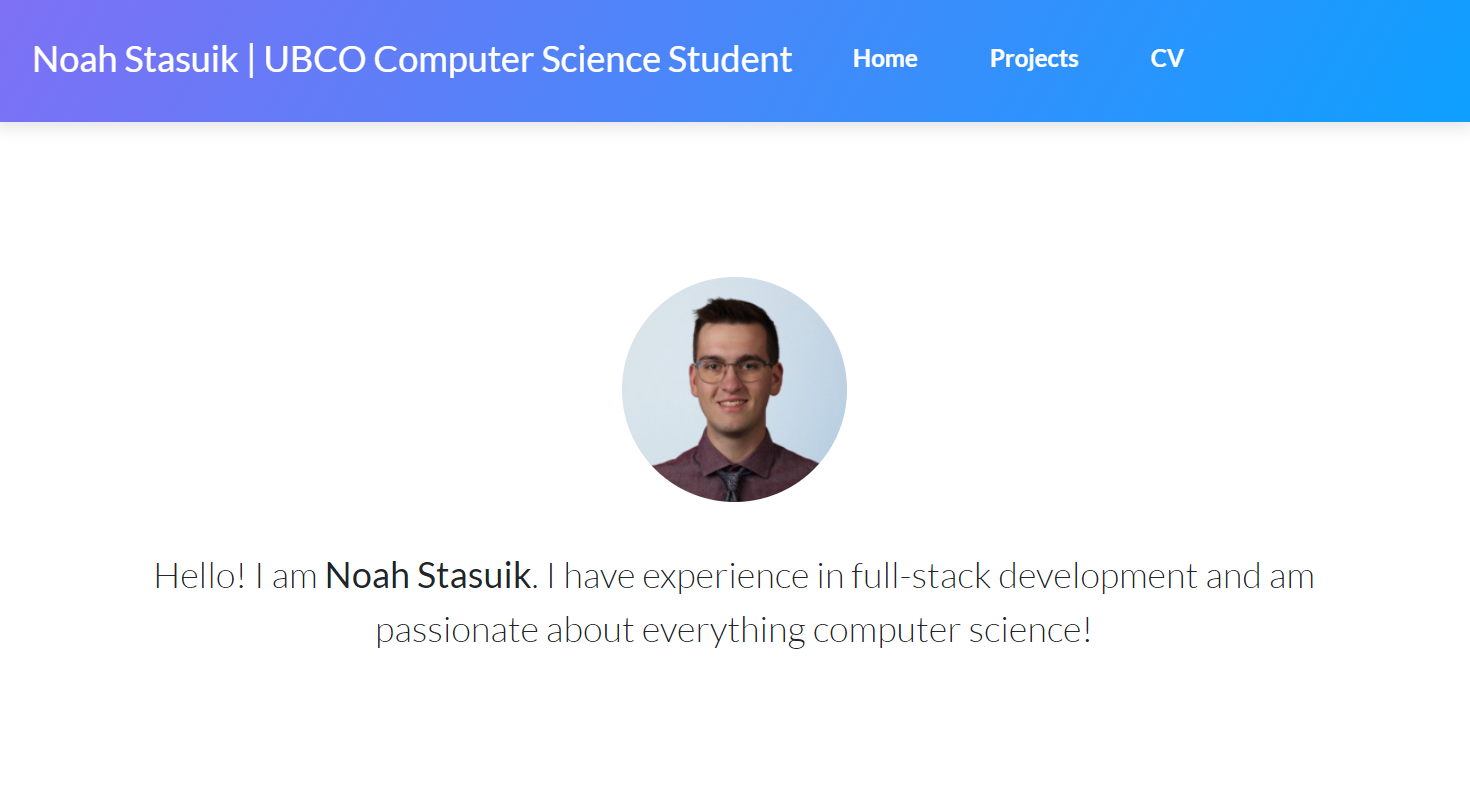
What's unique about my portfolio website project in comparison to my other projects, is that the website is an ongoing task and I will continue to improve it into the future!
The Website (Bootstrap / HTML / CSS)
This website is coded with Bootstrap, HTML and CSS and has the purpose of keeping track of my accomplishments related to CS and telling my story.
This website also acts as a place to store my projects and allows them to be used by others without having to clone my repositories. At the moment each project header brings users to either a demo of the project, or the project itself!
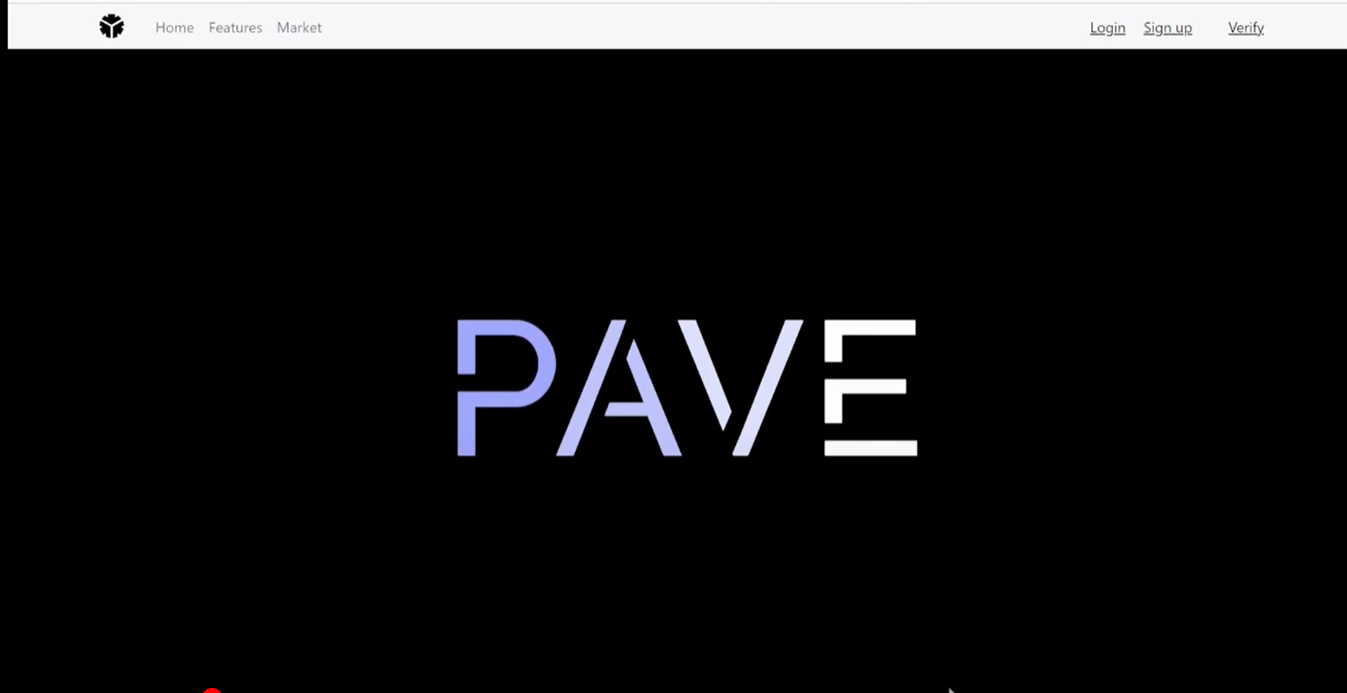
PAVE (P2P Digital Banking Platform)
The webapp (React JS)
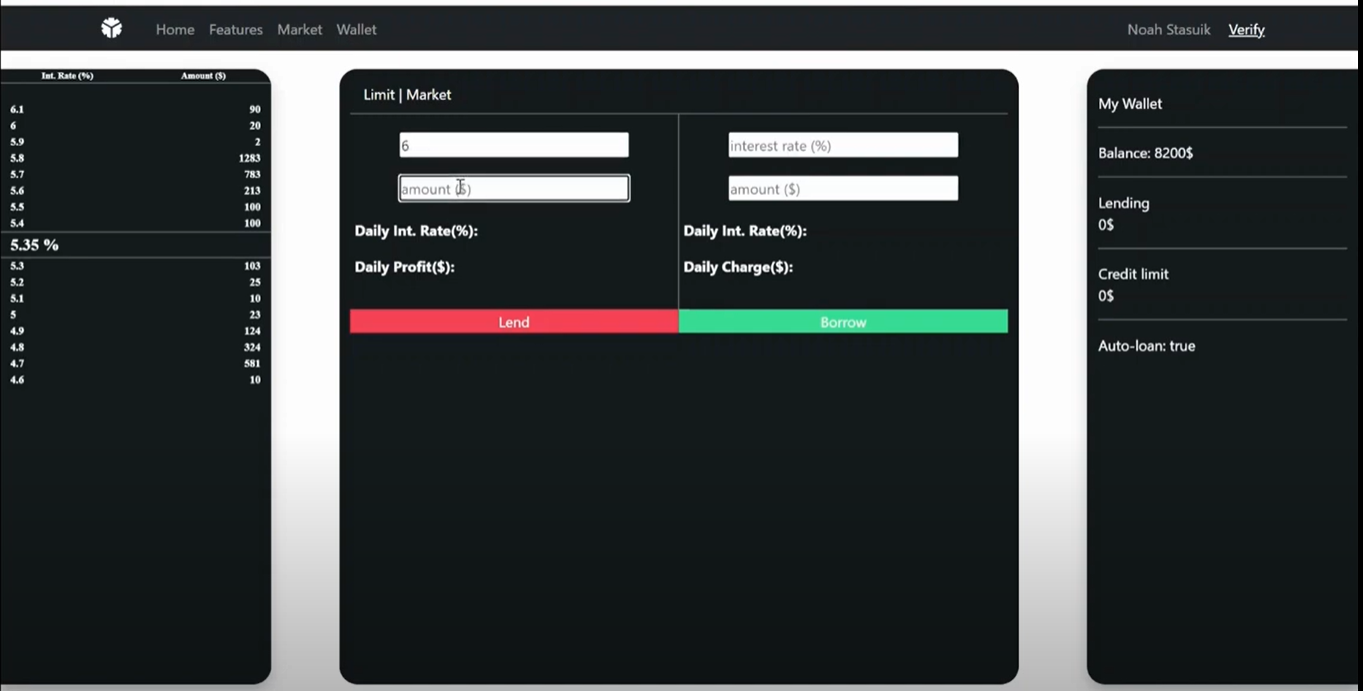
For the PAVE hackathon project my group created a webapp that allowed users to create an account and get trading.
The algorithm (React JS)
The main idea of PAVE was to take away some of the power from the banks and give it to everyday people. One of the main functionalities that we implemented to make this a reality was making it so that interest rates for loans and investing were based on a variable market index. We created the algorithm that would make this a reality on the web app.
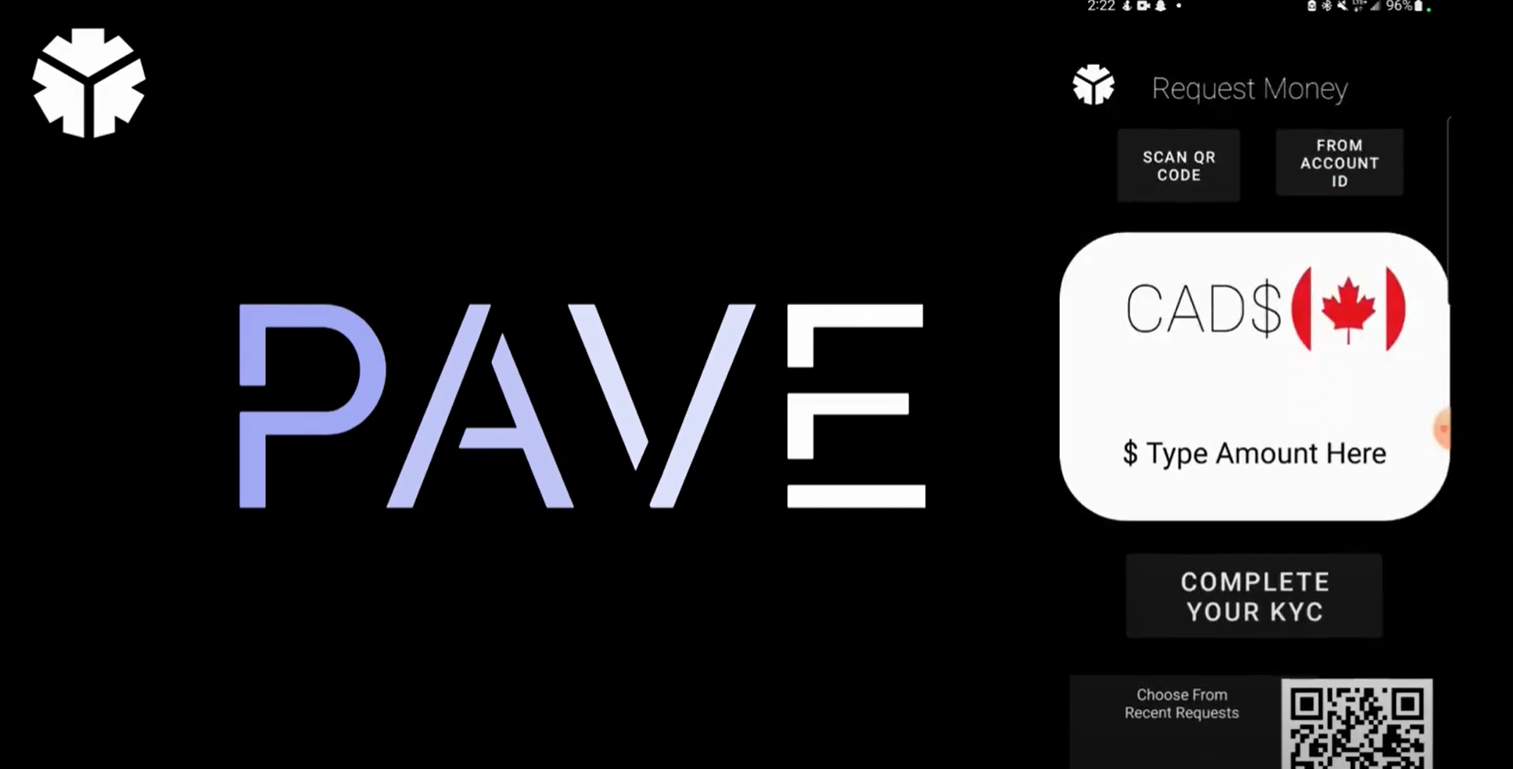
The mobile app (Android Studio / Java)
As a part of the project I decided to learn Android Studio and create an app that supported the functionality of our project.
COSC/DATA 301 Data Analysis Project
The EDA (Python/Pandas/Seaborn)
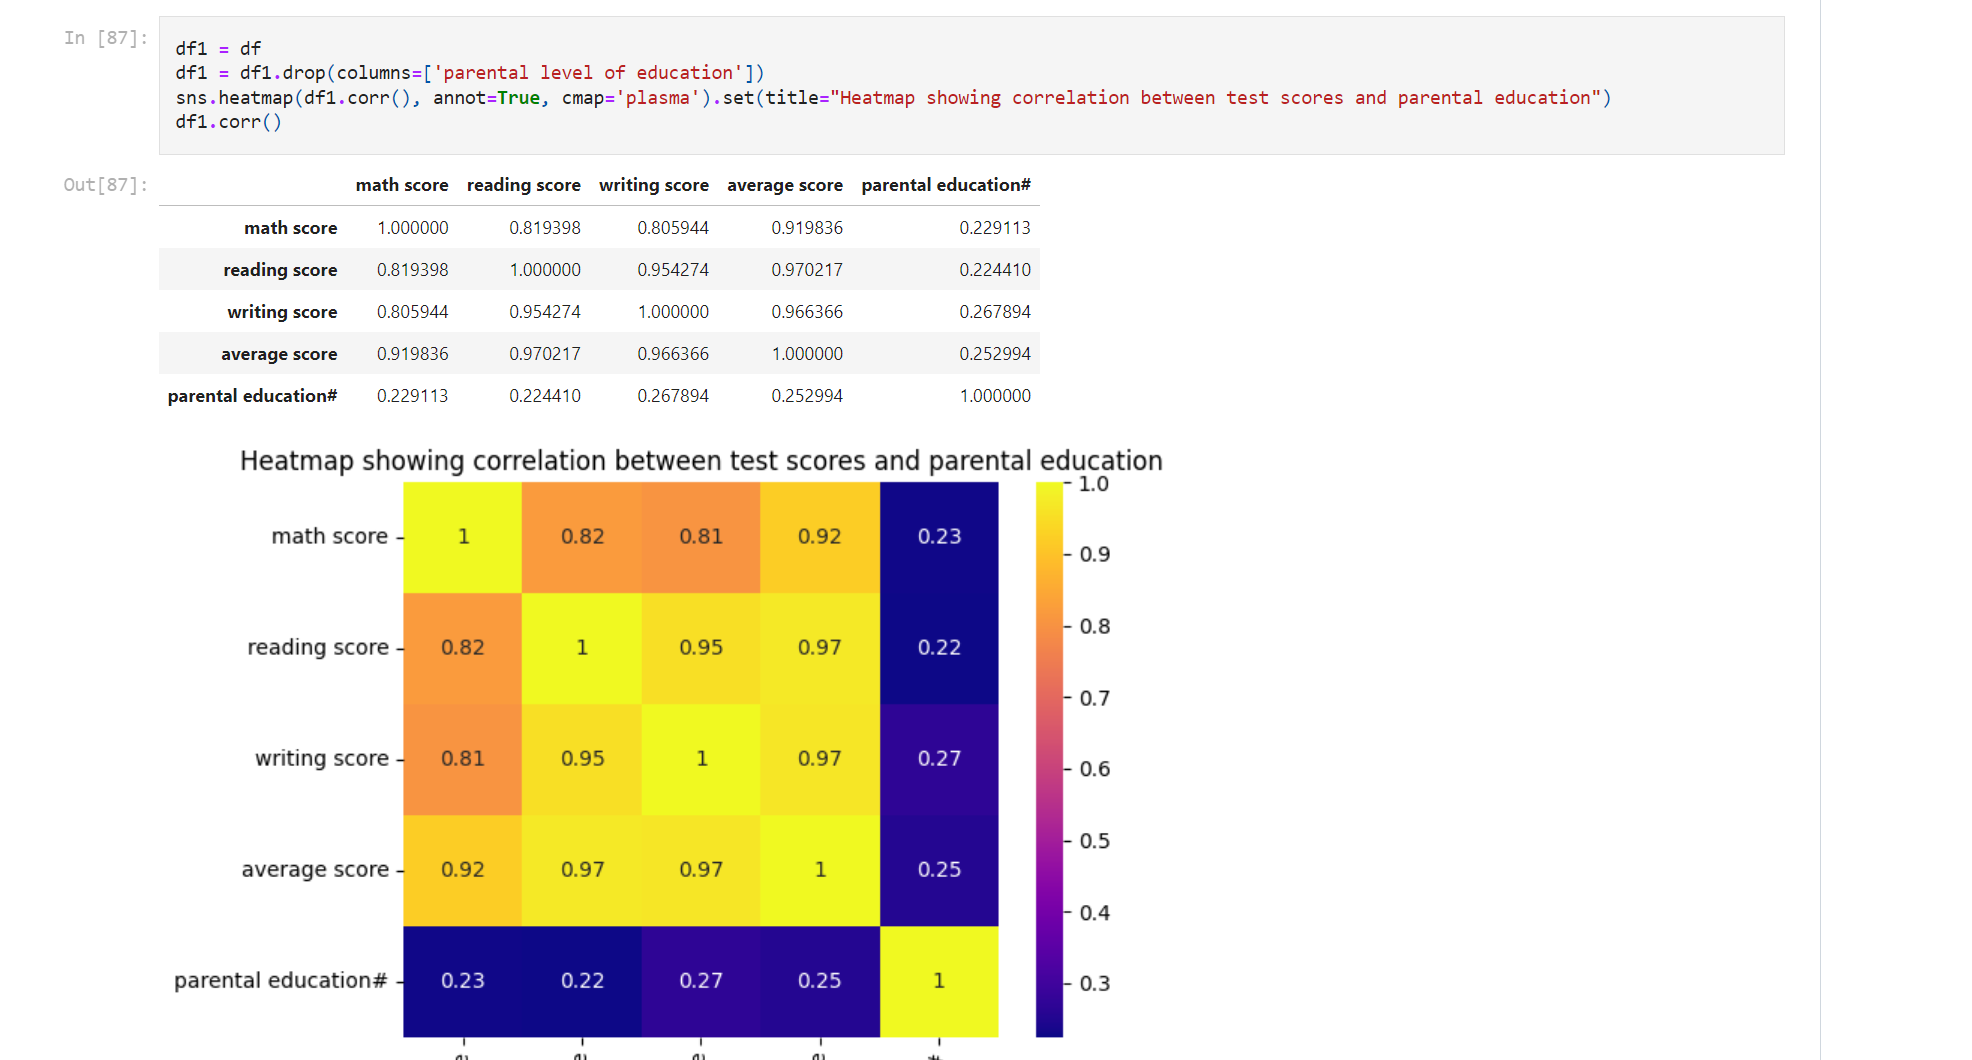
For this project I perfromed an EDA using Python, Pandas and Seaborn to find the relationship that exists between childrens grades on standardized tests and the level of education that thier parents had.
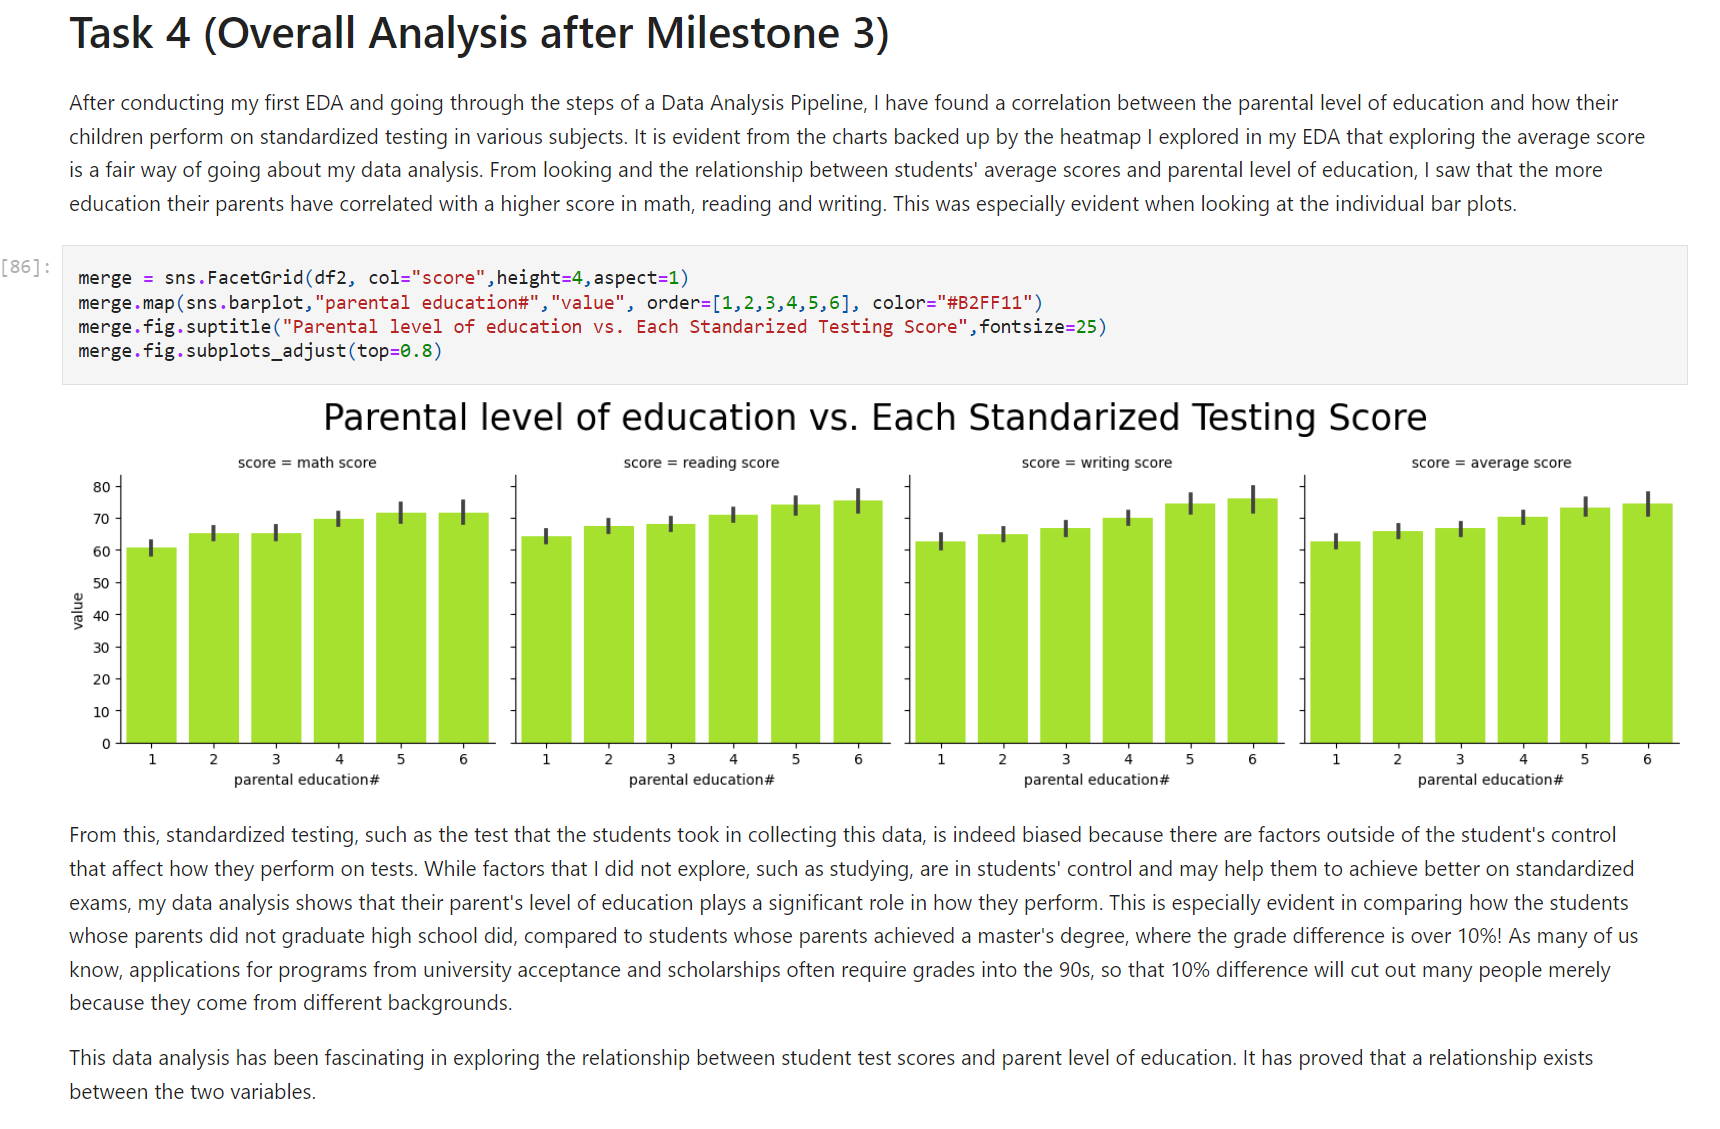
Data Analysis (Python/Pandas/Seaborn)
In the end of the Data Analysis I came up with the conclusion that a students parents having a higher level of education did indeed result in them doing better on standardized exams. More about my data analysis process can be found on my github.
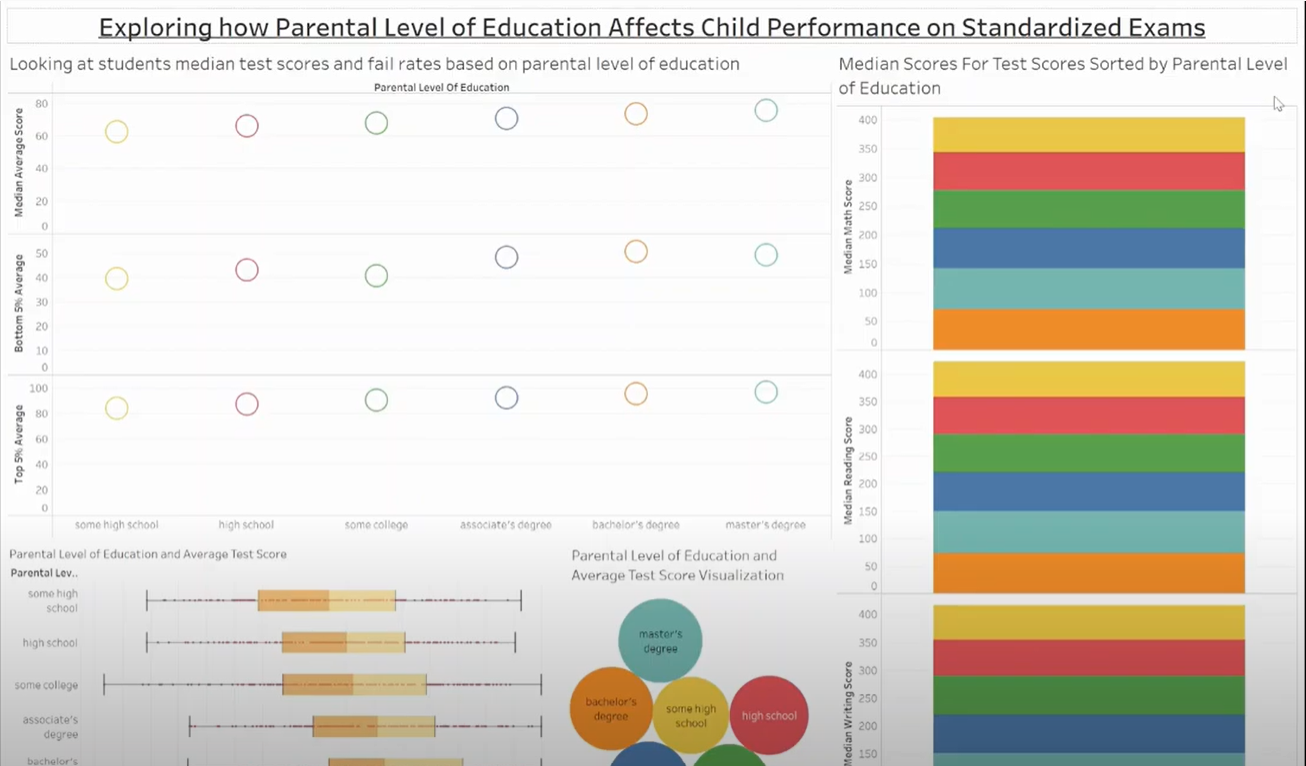
Our Findings (Tableau)
For this project I also learned how to use the software Tableau. I used Tableau to make various visualization that also backed up my hypothesis and conclusions.